 |
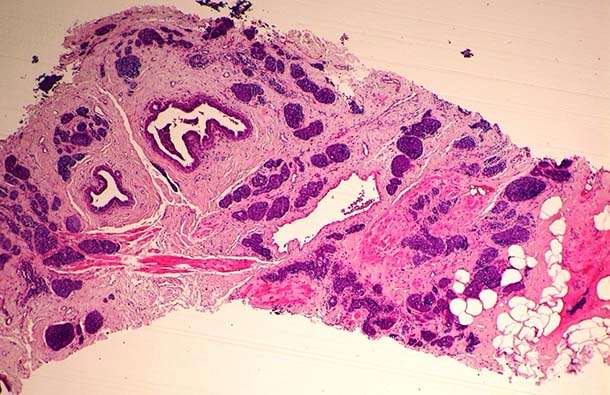 |
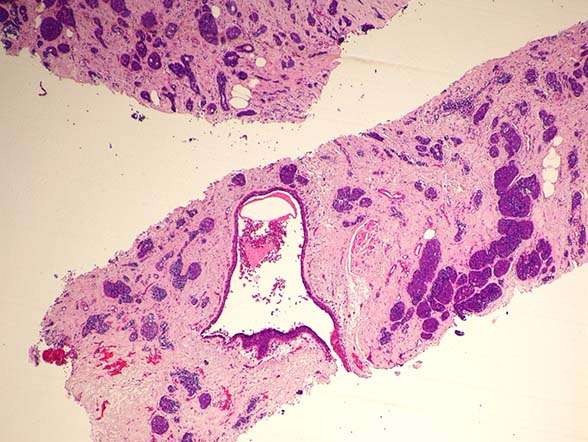
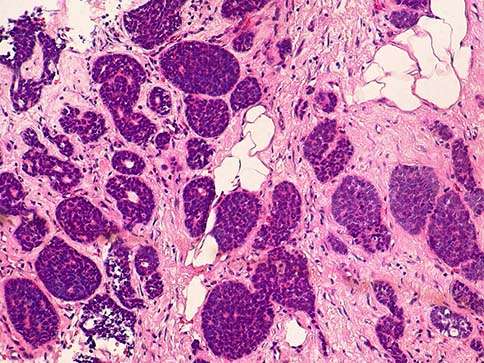
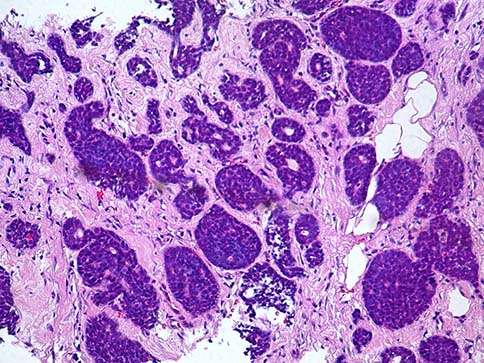
| Figure 1. H&E, 5x. | Figure 2. H&E, 5x. |
 |
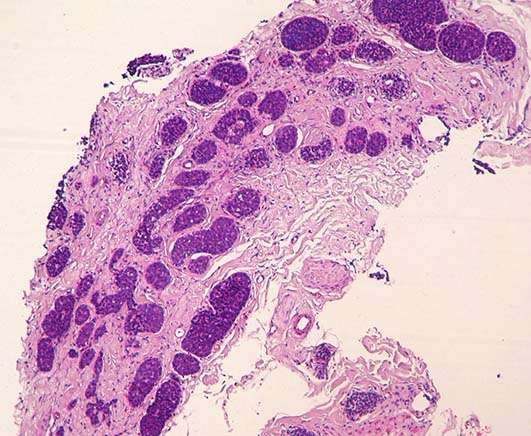 |
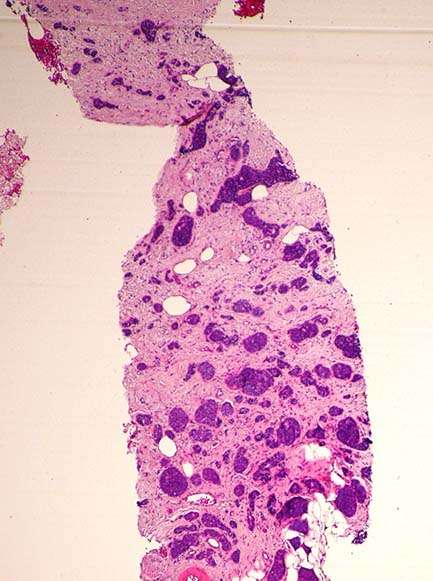
| Figure 3. H&E, 5x. | Figure 4. H&E, 5x. |
 |
 |
| Figure 5. H&E, 10x. | Figure 6. H&E, 10x. |
 |
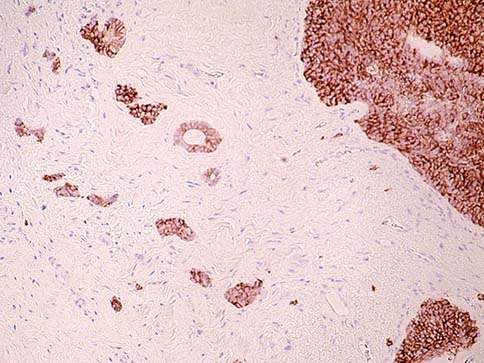 |
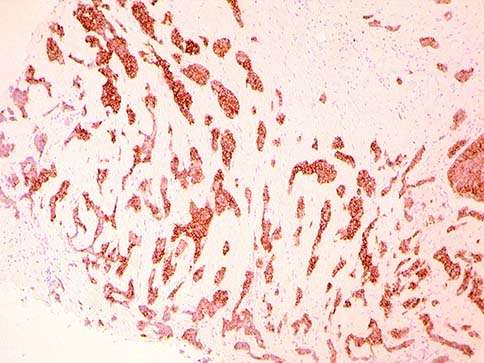
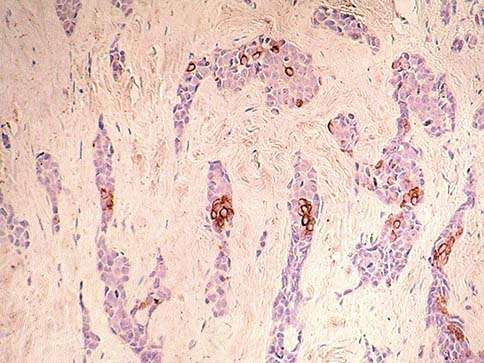
| Figure 7. cKit (CD117) expression ih the tumor cells, 5x. | Figure 8. cKit (CD117) expression, 5x. |
 |
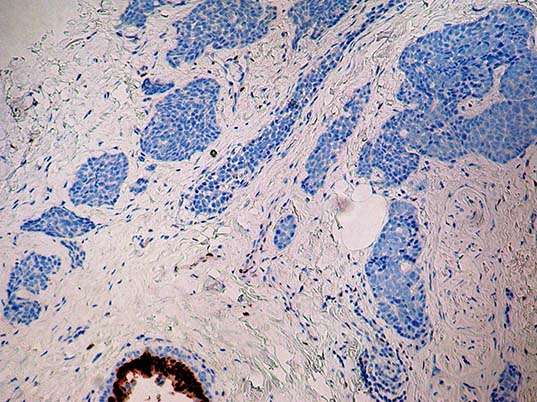 |
| Figure 9. Focal CK14 expression in the tumor cells, 10x. | Figure 10. The tumor cells were negative for ER; note the positivity of ER in adjacent normal ducts, 10x. |
 |
 |
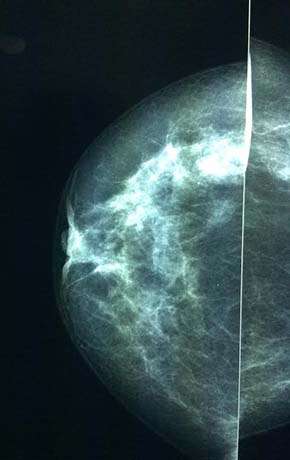
| Figure 11. Mammography. | Figure 12. MRI of the right breast with a tumor mass. |

Copyright 2012 – 2024 | BosnianPathology.org | Semir Vranic MD, PhD | Faruk Skenderi MD, PhD
next generation pathology