 |
 |
|
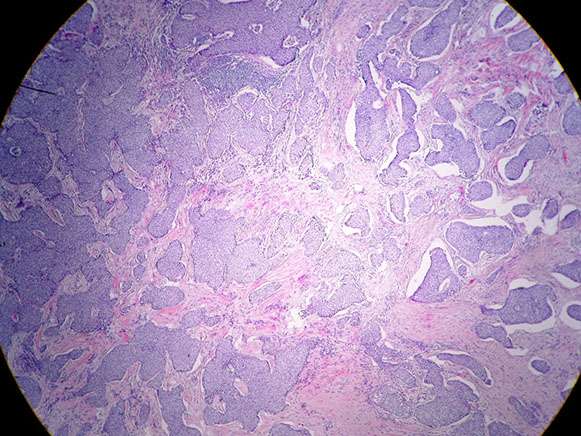
Figure 1. H&E, 5x. |
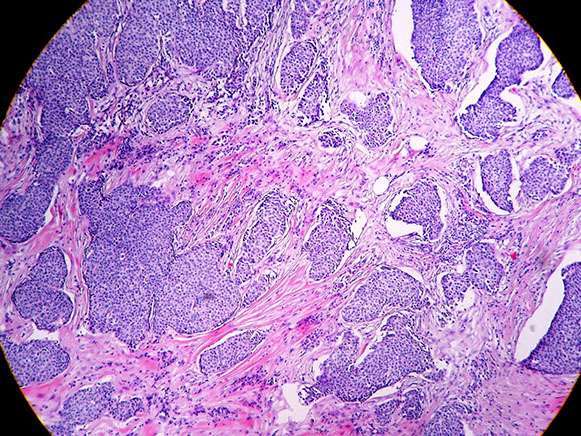
Figure 2. H&E, 10x. |
 |
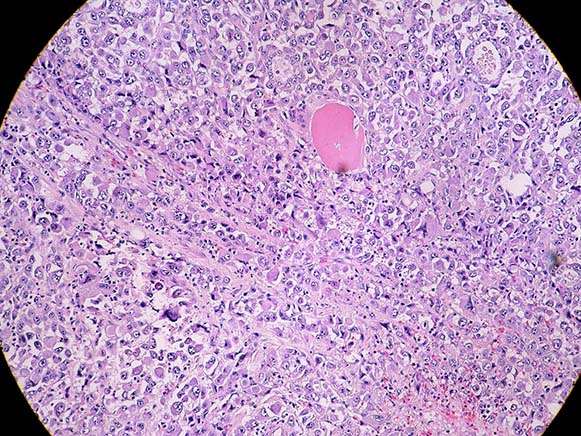 |
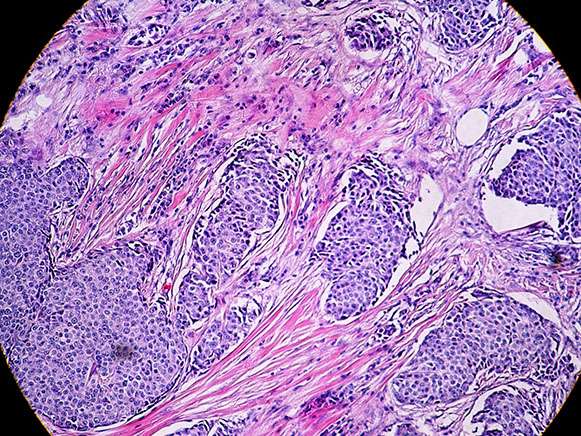
| Figure 3. H&E, 20x. | Figure 4. H&E, 20x. |
 |
|
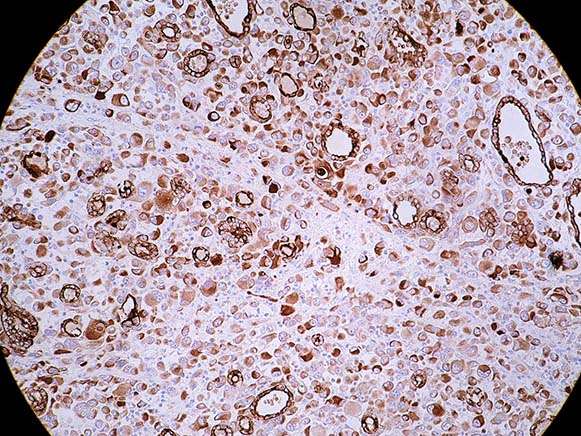
| Figure 5. AE1/AE3 expression in the tumor cells, 10x (note also AE1/AE3 expression in normal thyroid follicles) | Figure 6. AE1/AE3 expression, 20x. |
 |
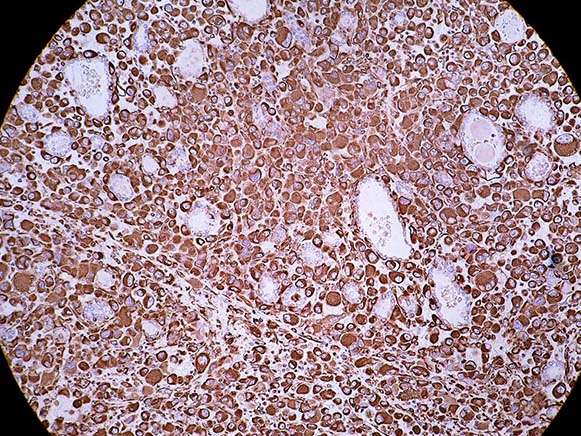 |
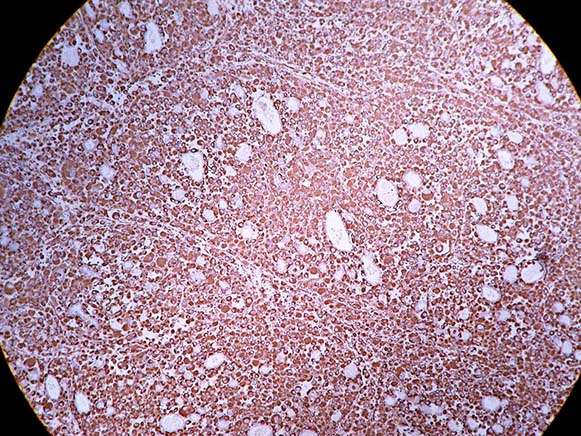
| Figure 7. Vimentin expression, 10x. | Figure 8. Vimentin expression, 20x. |
 |
|
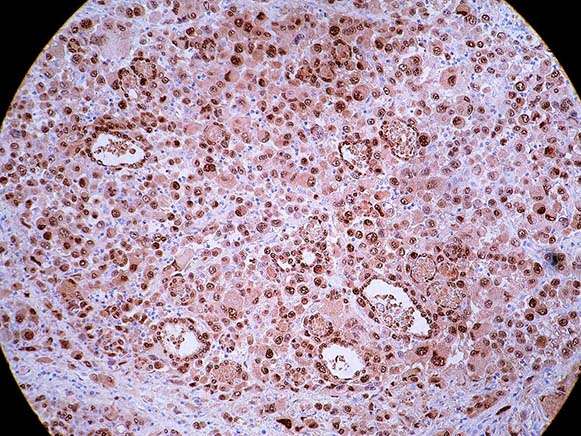
| Figure 9. Pax-8 expression in the tumor cells (note PAX-8 expression in the residual thyroid follicles), 10x. |

Copyright 2012 – 2024 | BosnianPathology.org | Semir Vranic MD, PhD | Faruk Skenderi MD, PhD
next generation pathology