 |
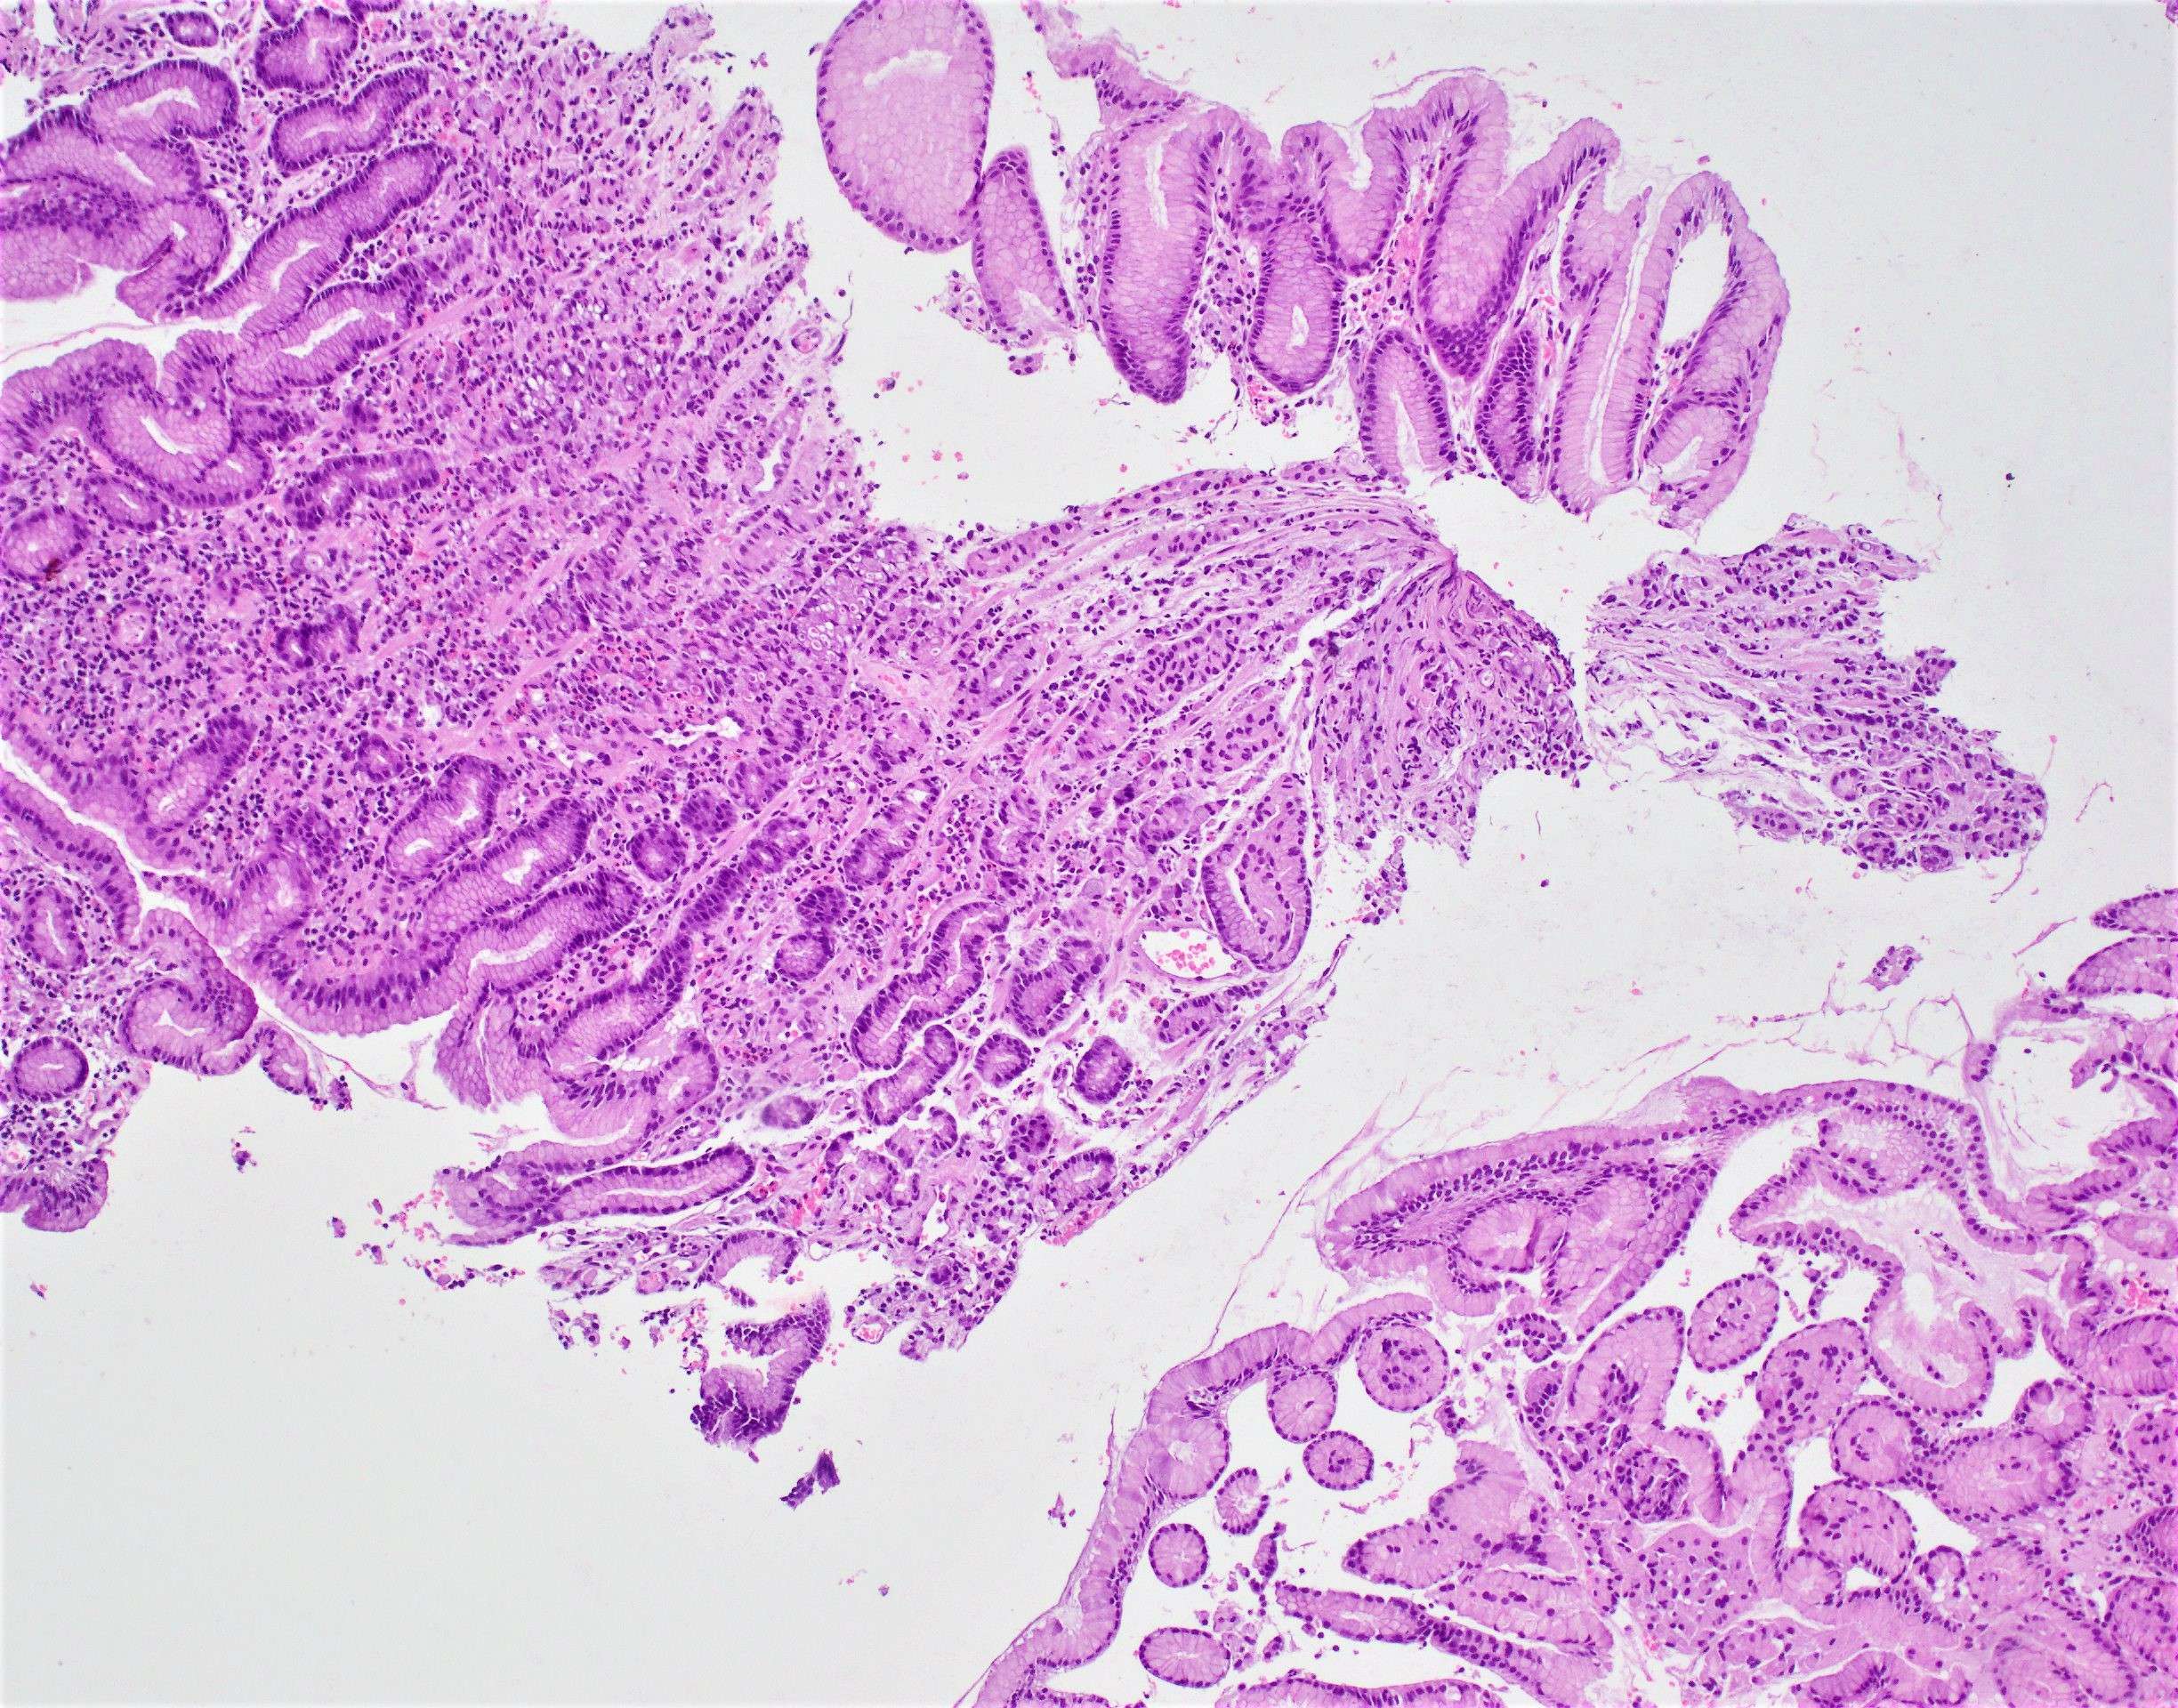 |
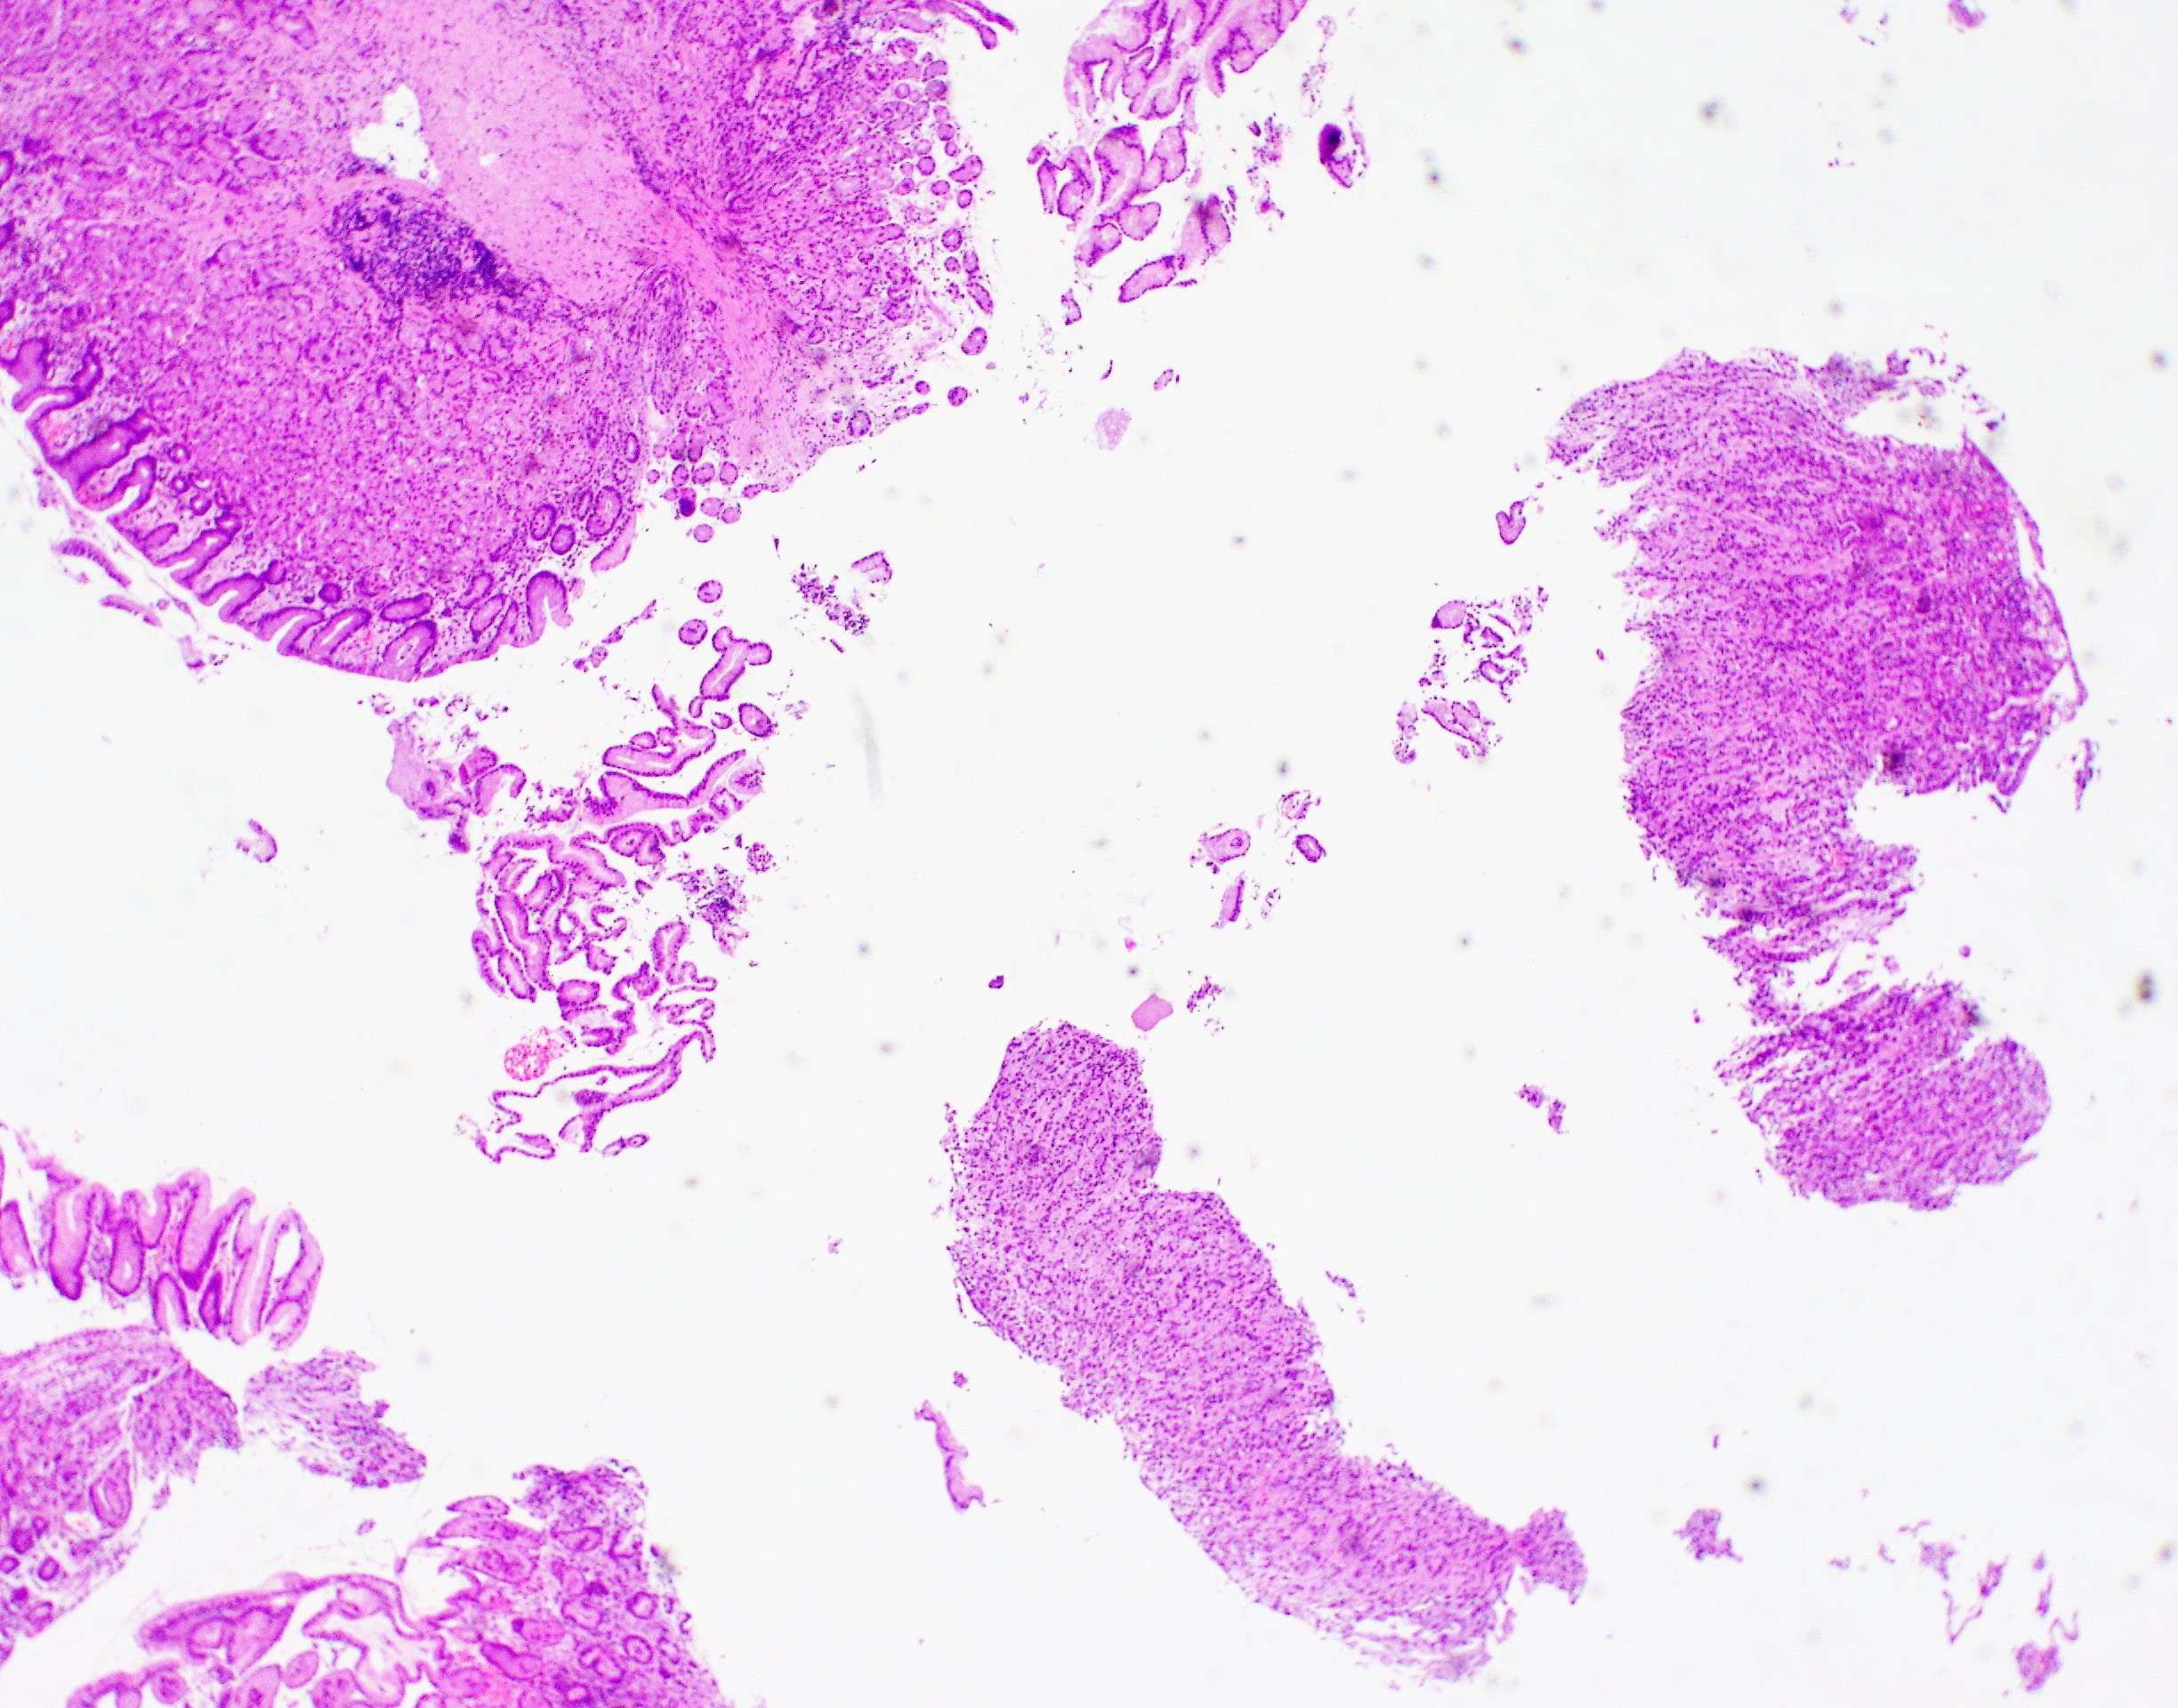
| Figure 1. H&E, 4x. | Figure 2. H&E, 10x. |
 |
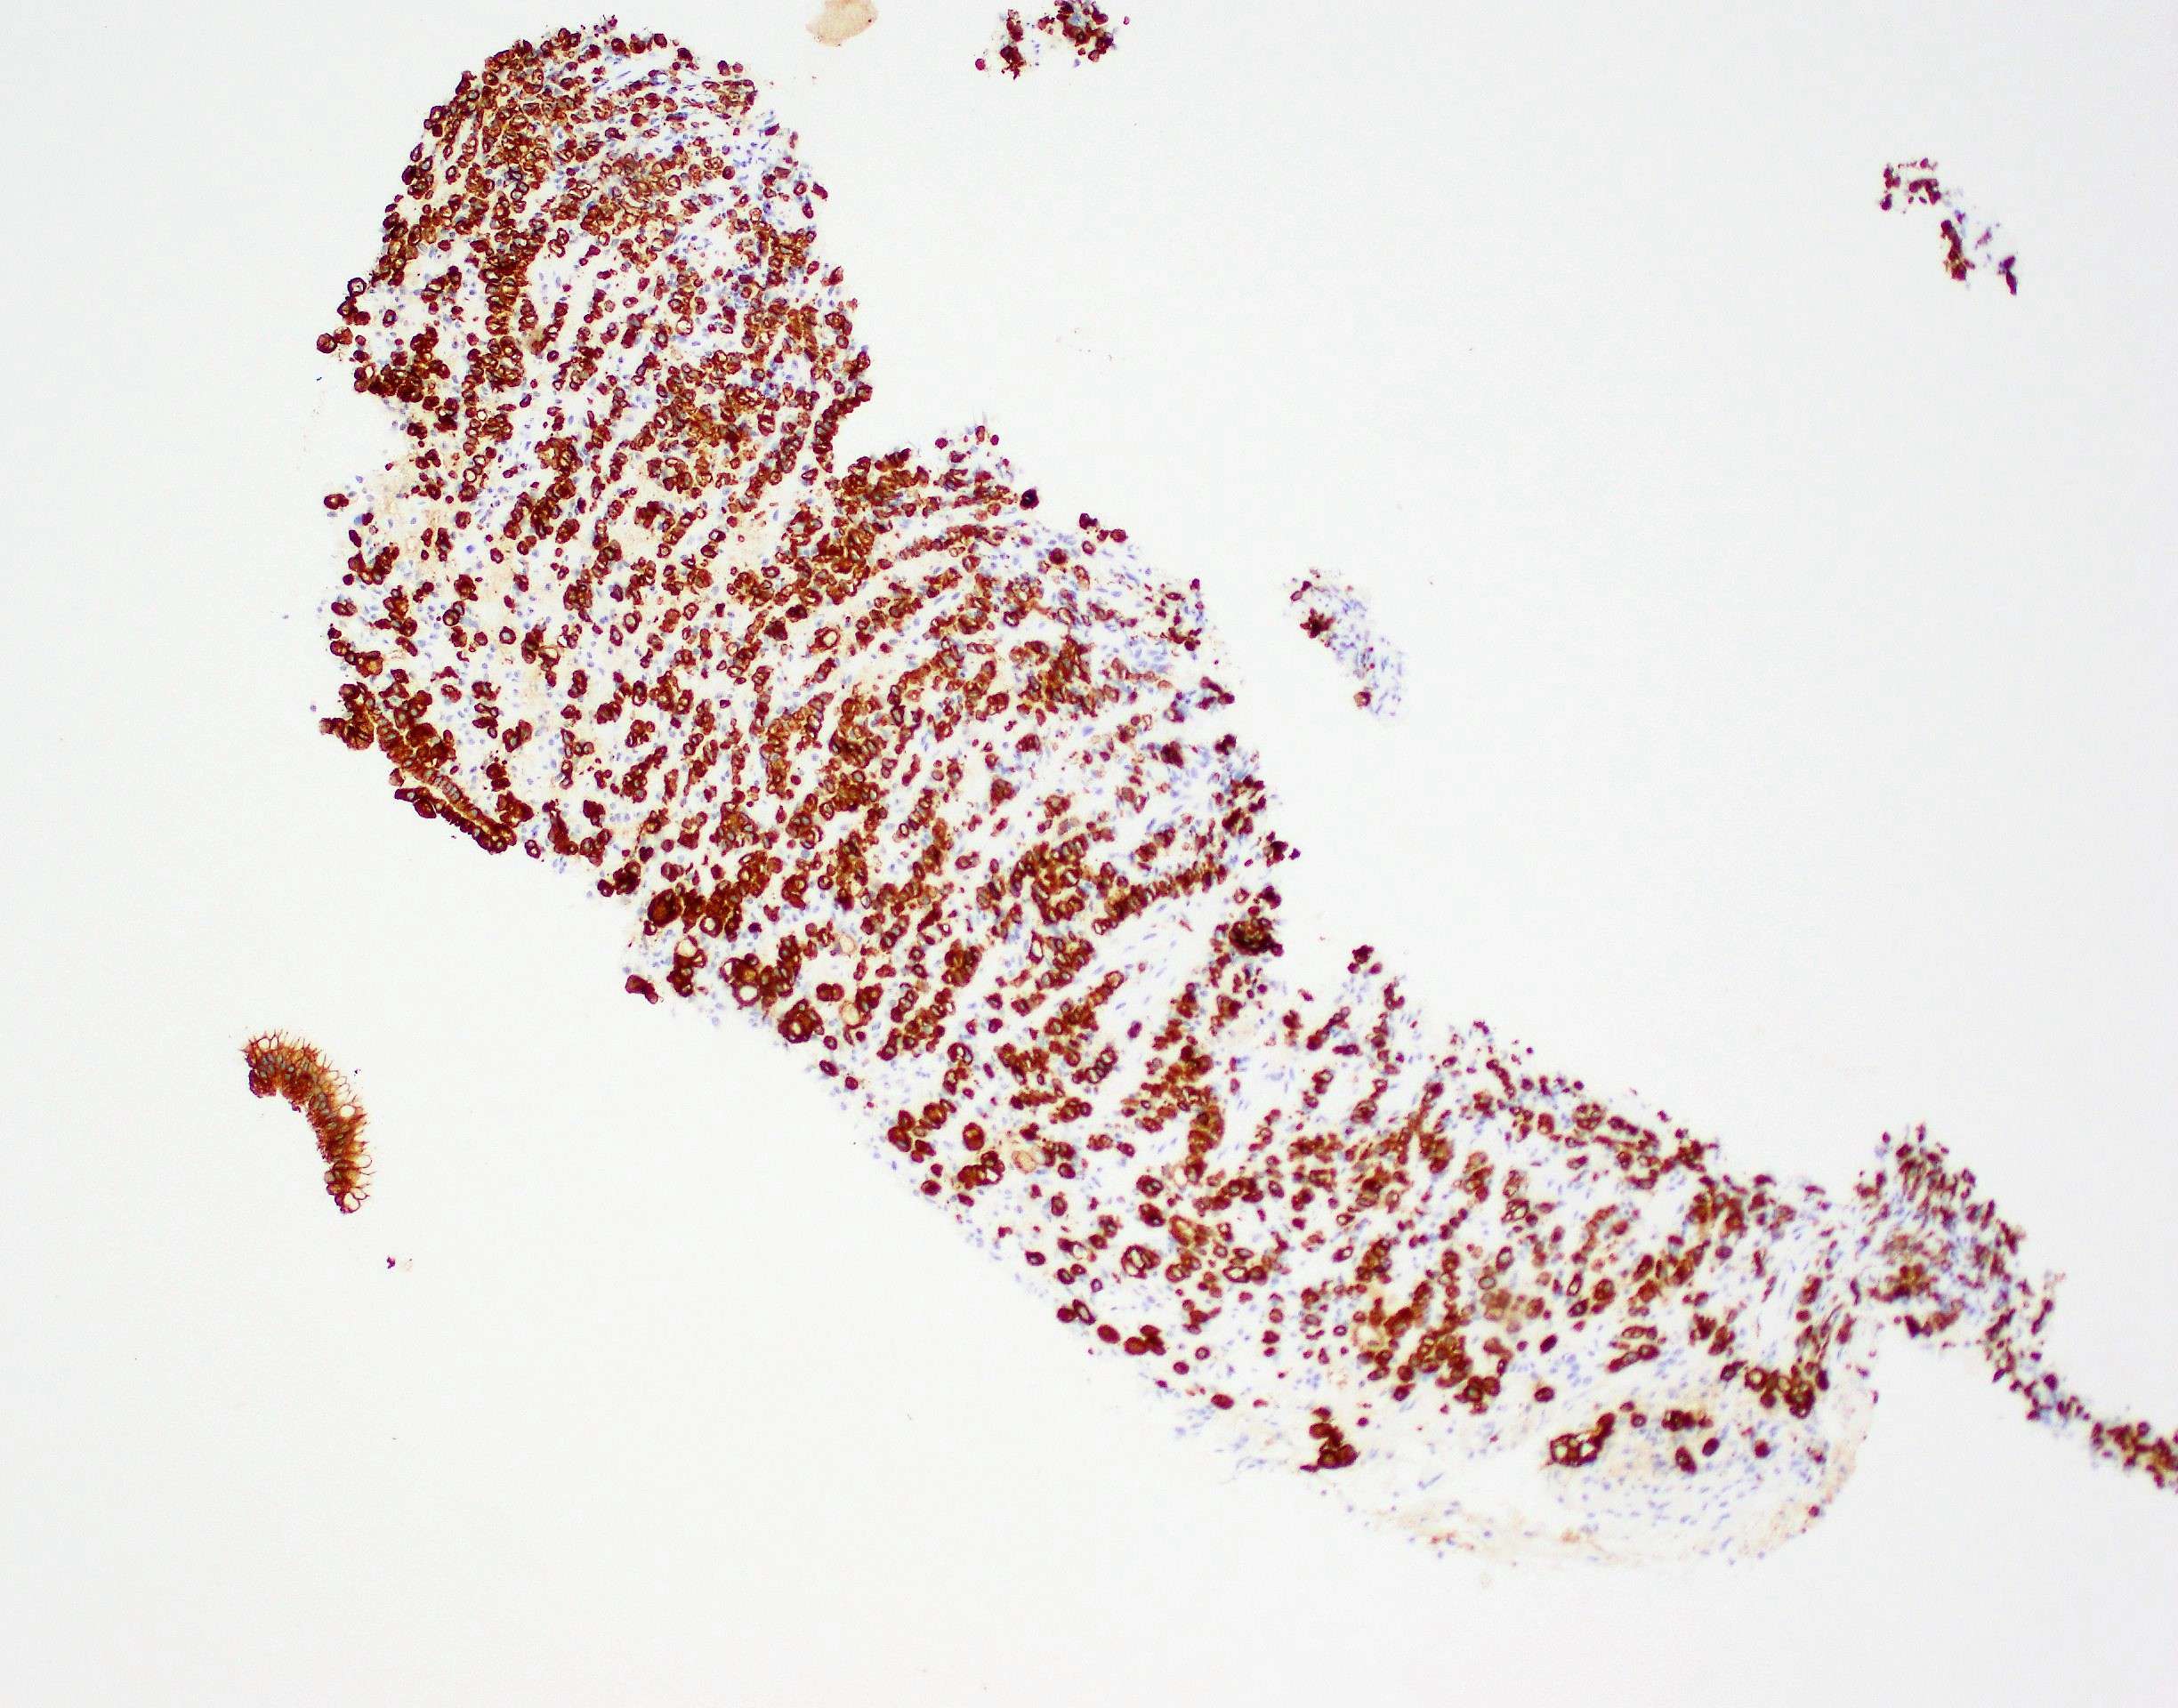 |
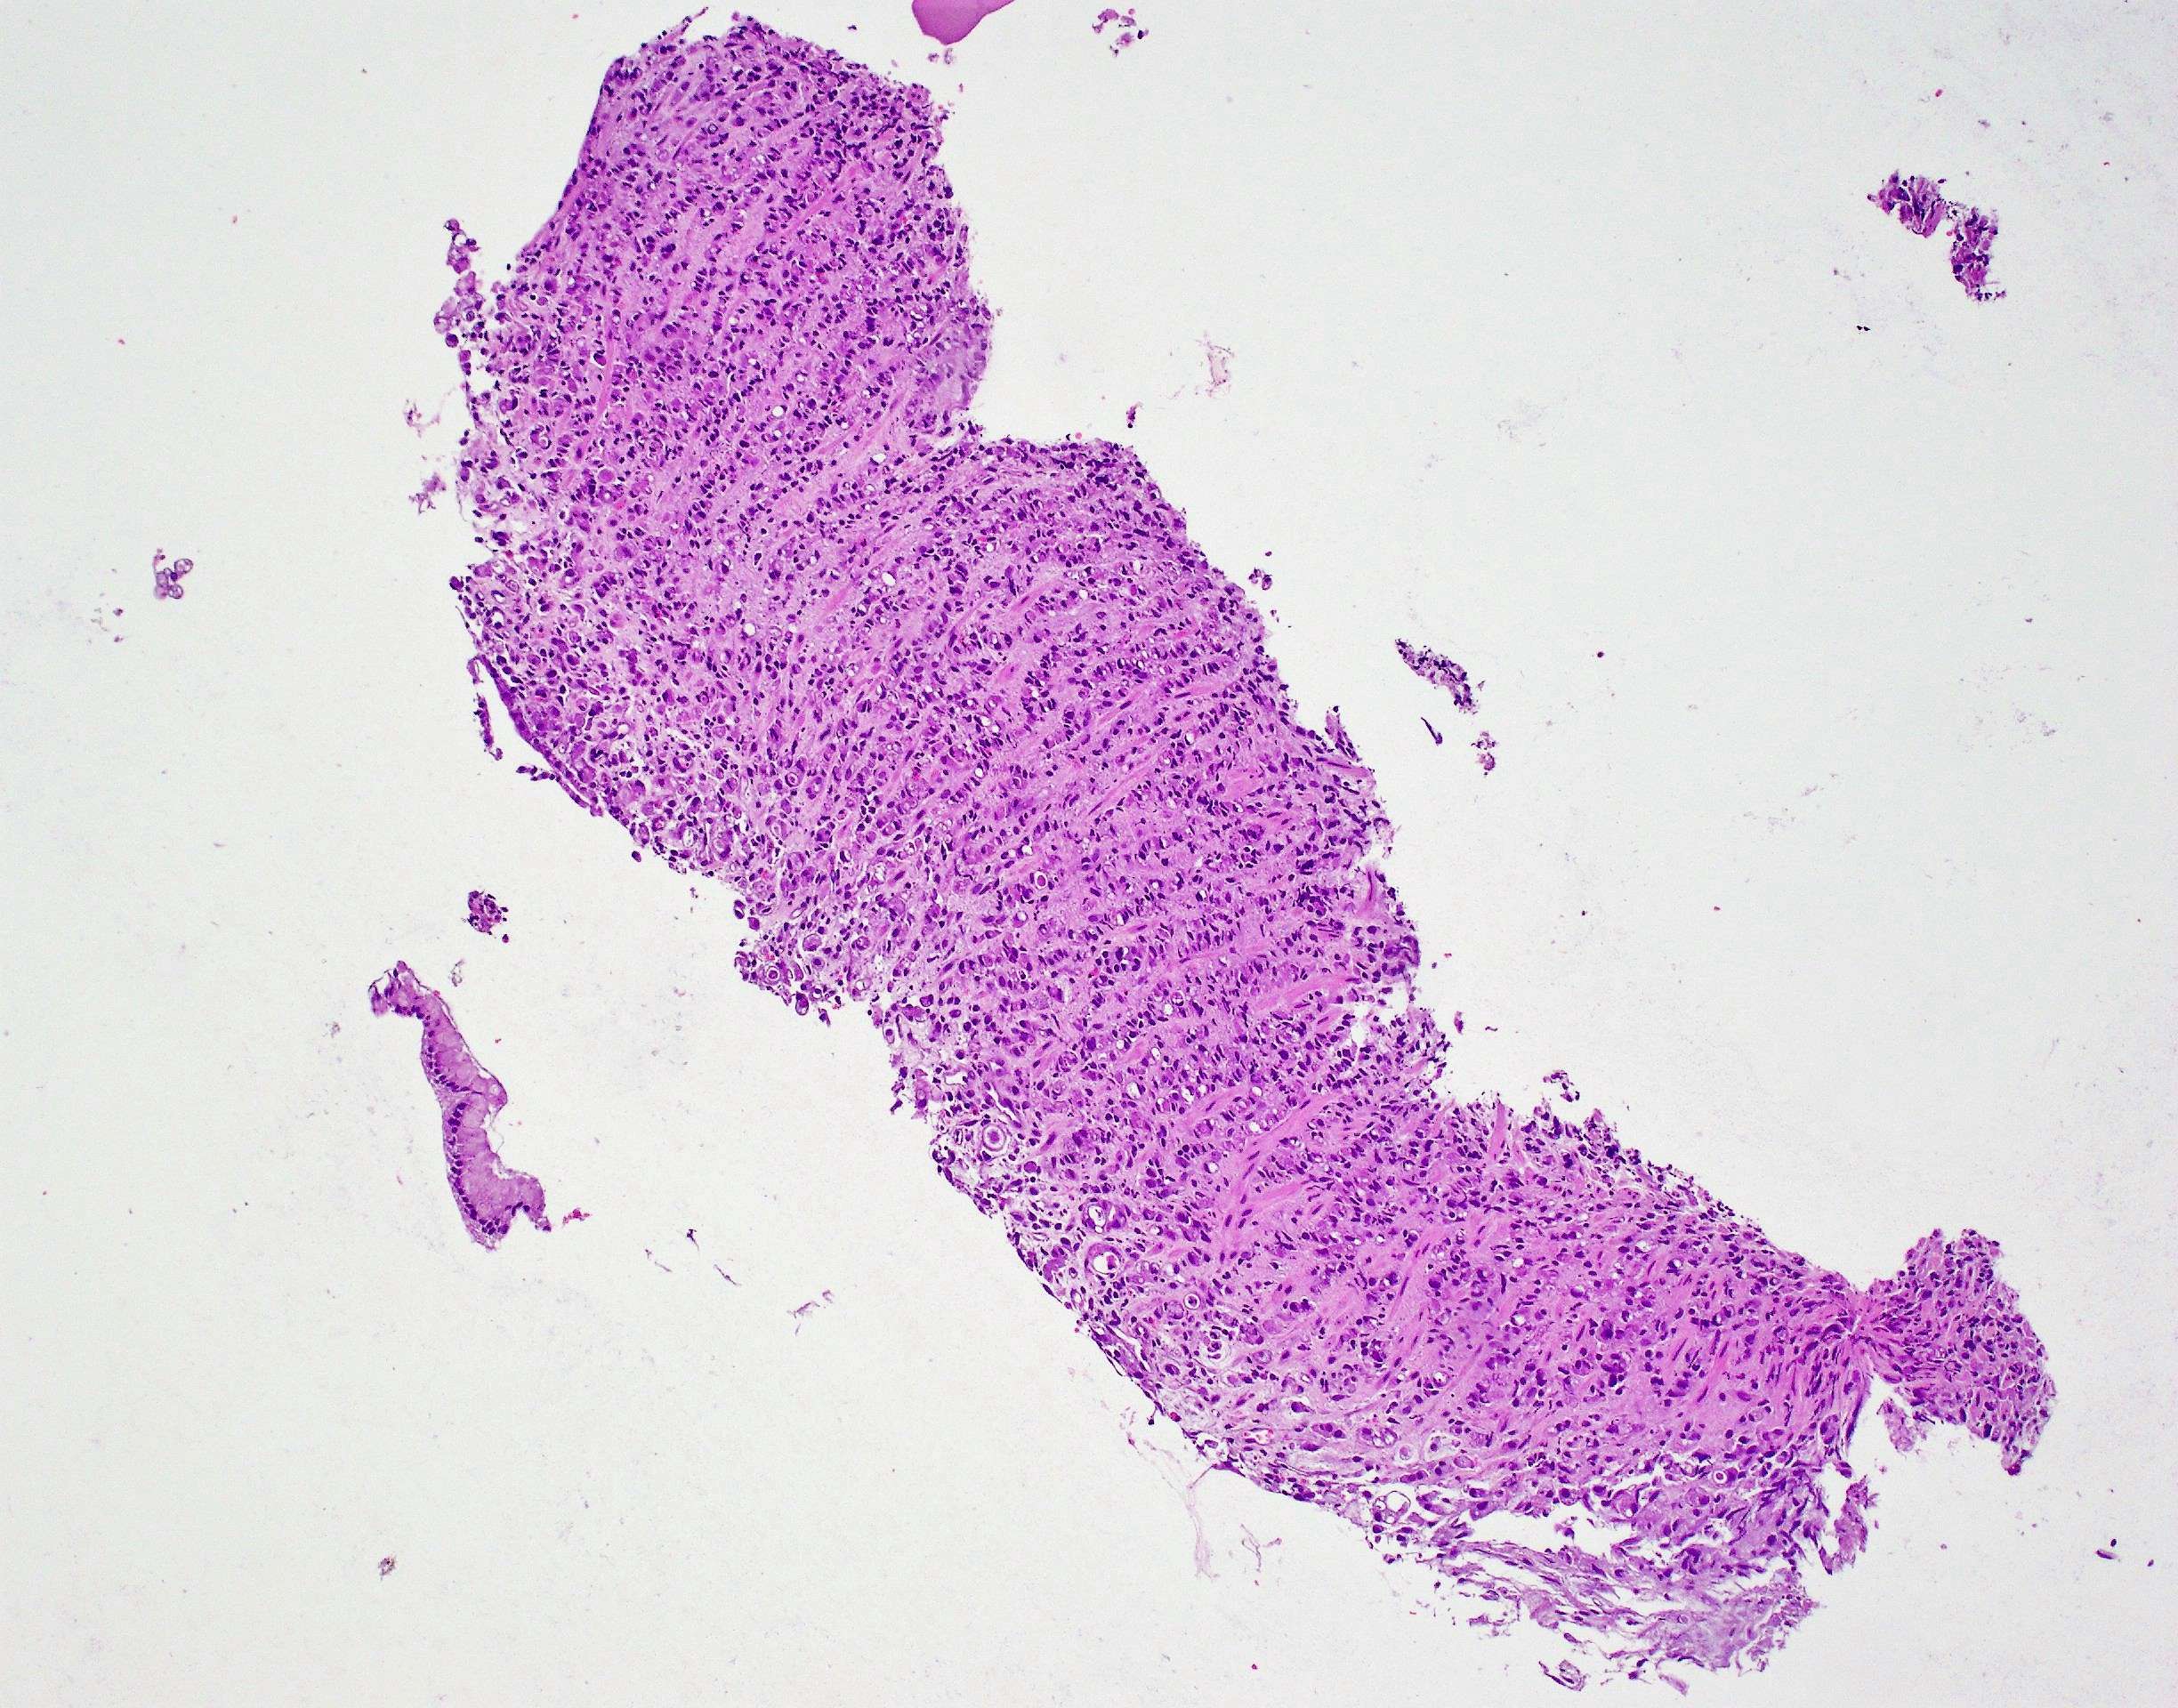
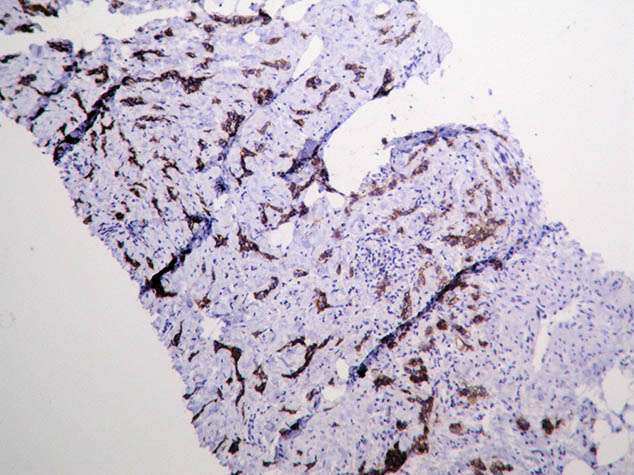
| Figure 3. H&E, 10x | Figure 4. Pan-CK (AE1/AE3) expression in cancer cells. |
 |
|
| Figure 5. A loss of E-cadherin expression in cancer cells. Please note the retained E-cadherin expression in residual normal/benign gastric glands. |

Copyright 2012 – 2024 | BosnianPathology.org | Semir Vranic MD, PhD | Faruk Skenderi MD, PhD
next generation pathology