 |
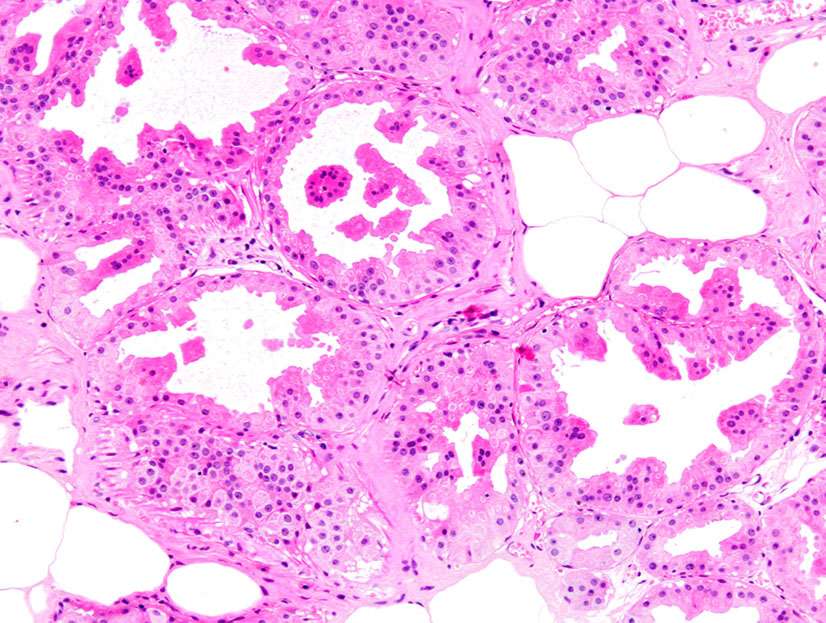 |
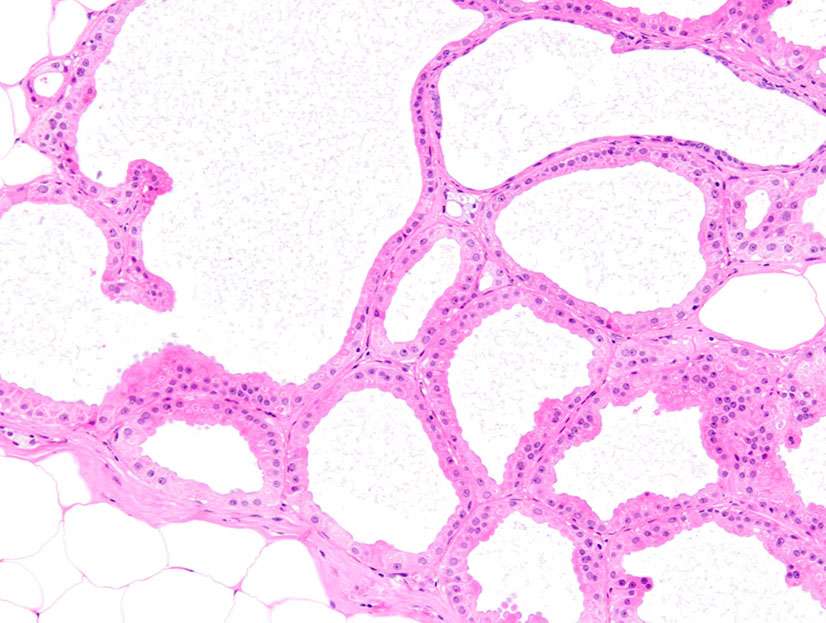
| Figure 1. H&E, complex apocrine metaplasia associated with invasive apocrine carcinoma and apocrine DCIS (not shown), 10x. | Figure 2. H&E, Complex apocrine metaplasia, 10x. |
 |
 |
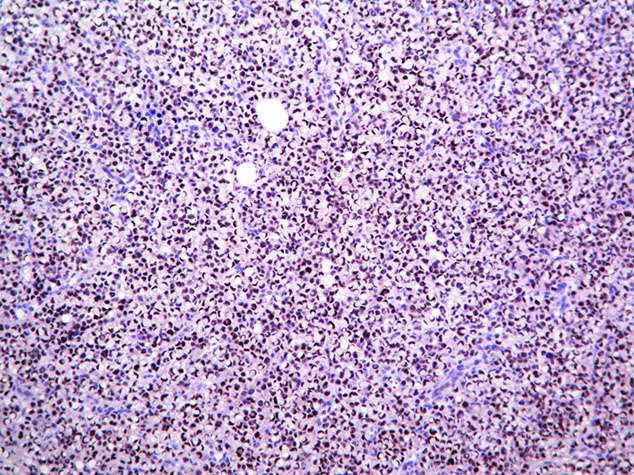
| Figure 3. Androgen receptor expression, 10x. |
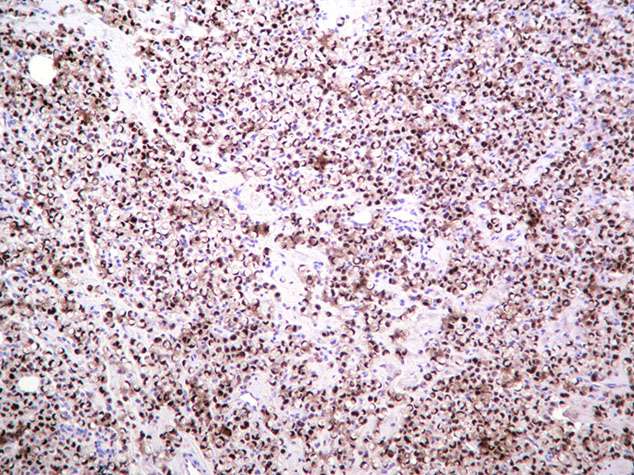
Figure 4. The lack of Estrogen receptor expression (note the presence of ER in adjacent benign/normal ducts), 10x. |
 |
 |
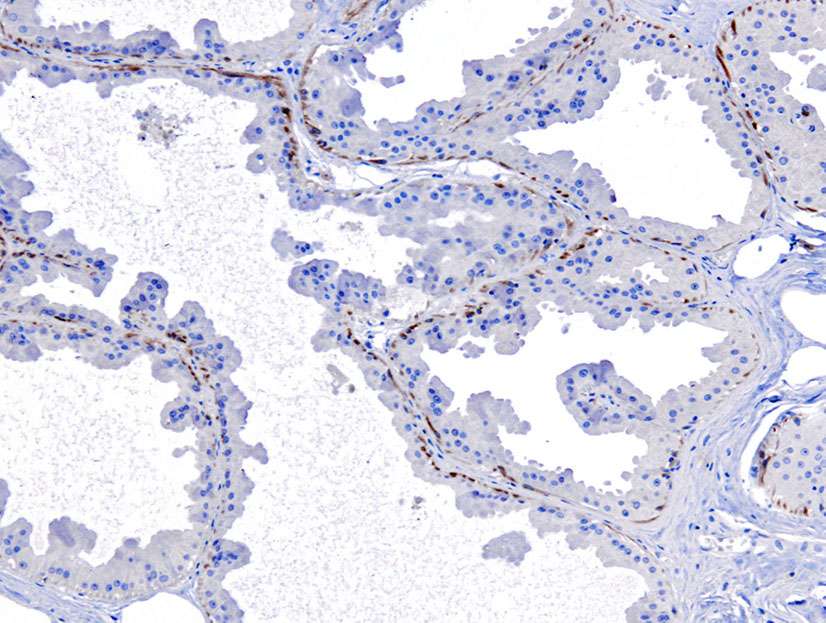
| Figure 5. The presence of basal layer highlighted by cytokeratin 5/6 expression, 10x. | Figure 6. p63 expression shows the presence of basal/myoepithelial cell layer, 10x. |

Copyright 2012 – 2024 | BosnianPathology.org | Semir Vranic MD, PhD | Faruk Skenderi MD, PhD
next generation pathology