 |
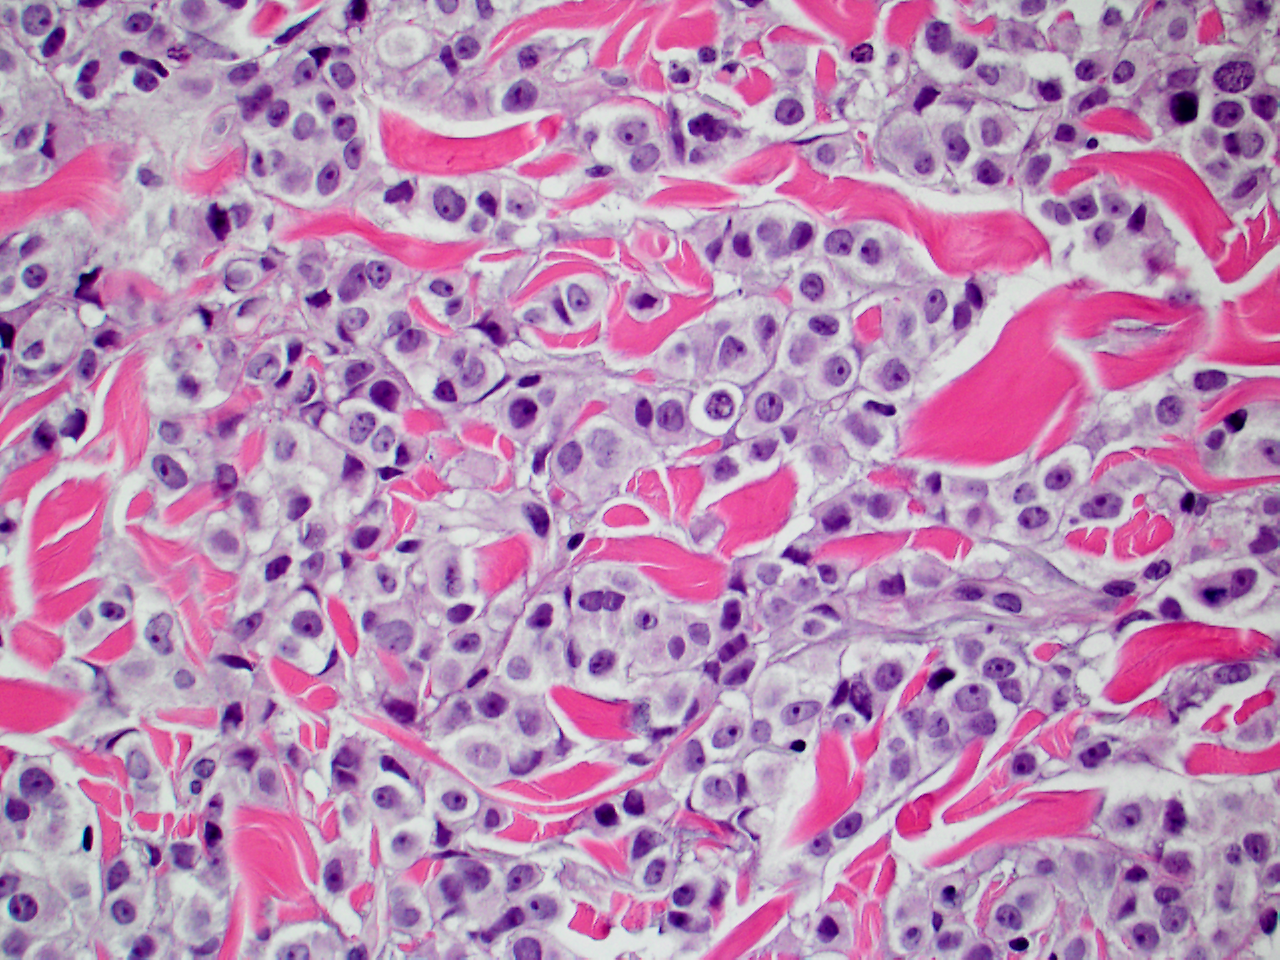 |
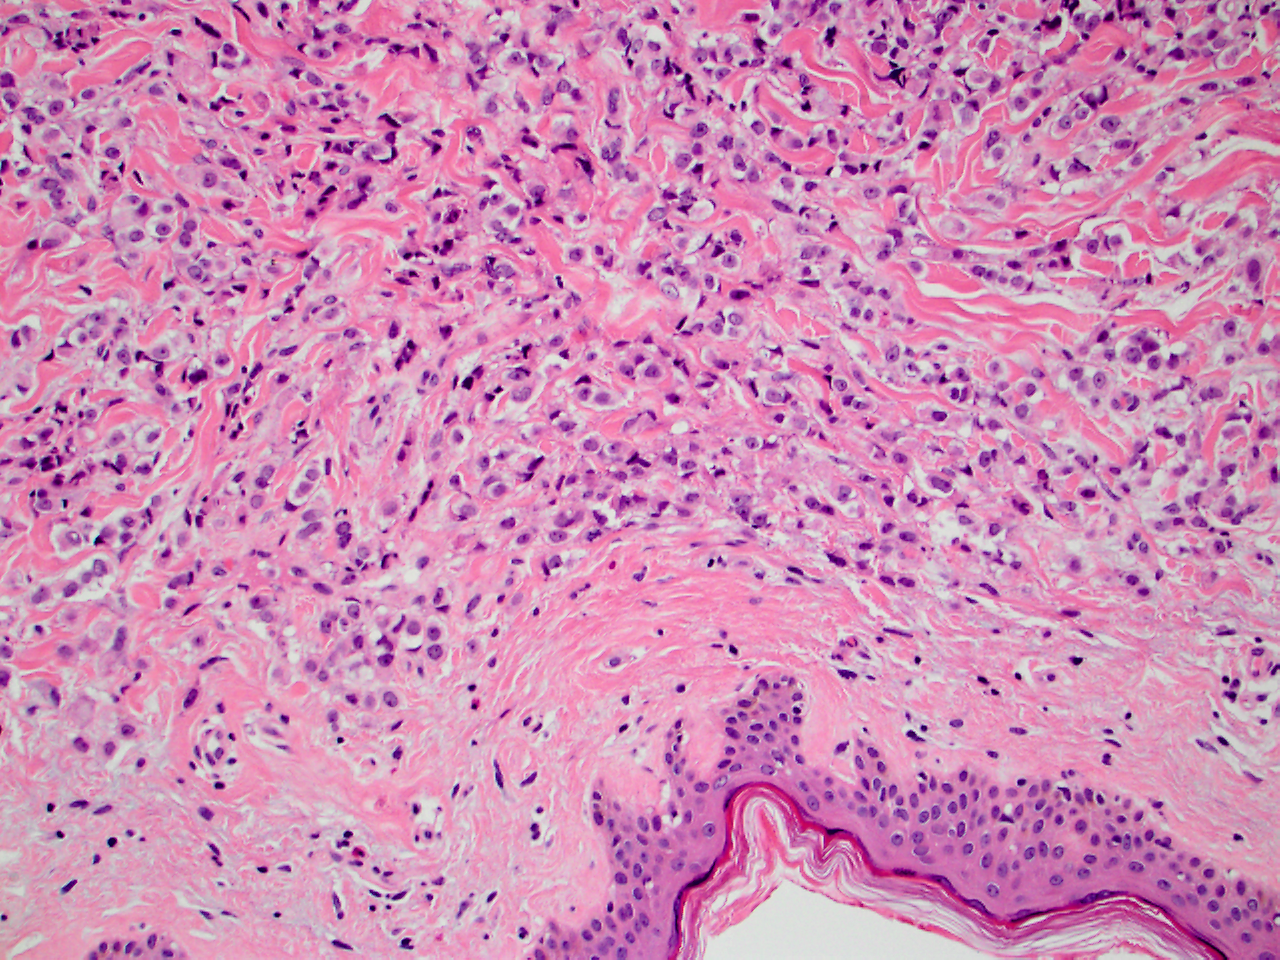
| Figure 1. H&E, 10x. | Figure 2. H&E, 20x. |
 |
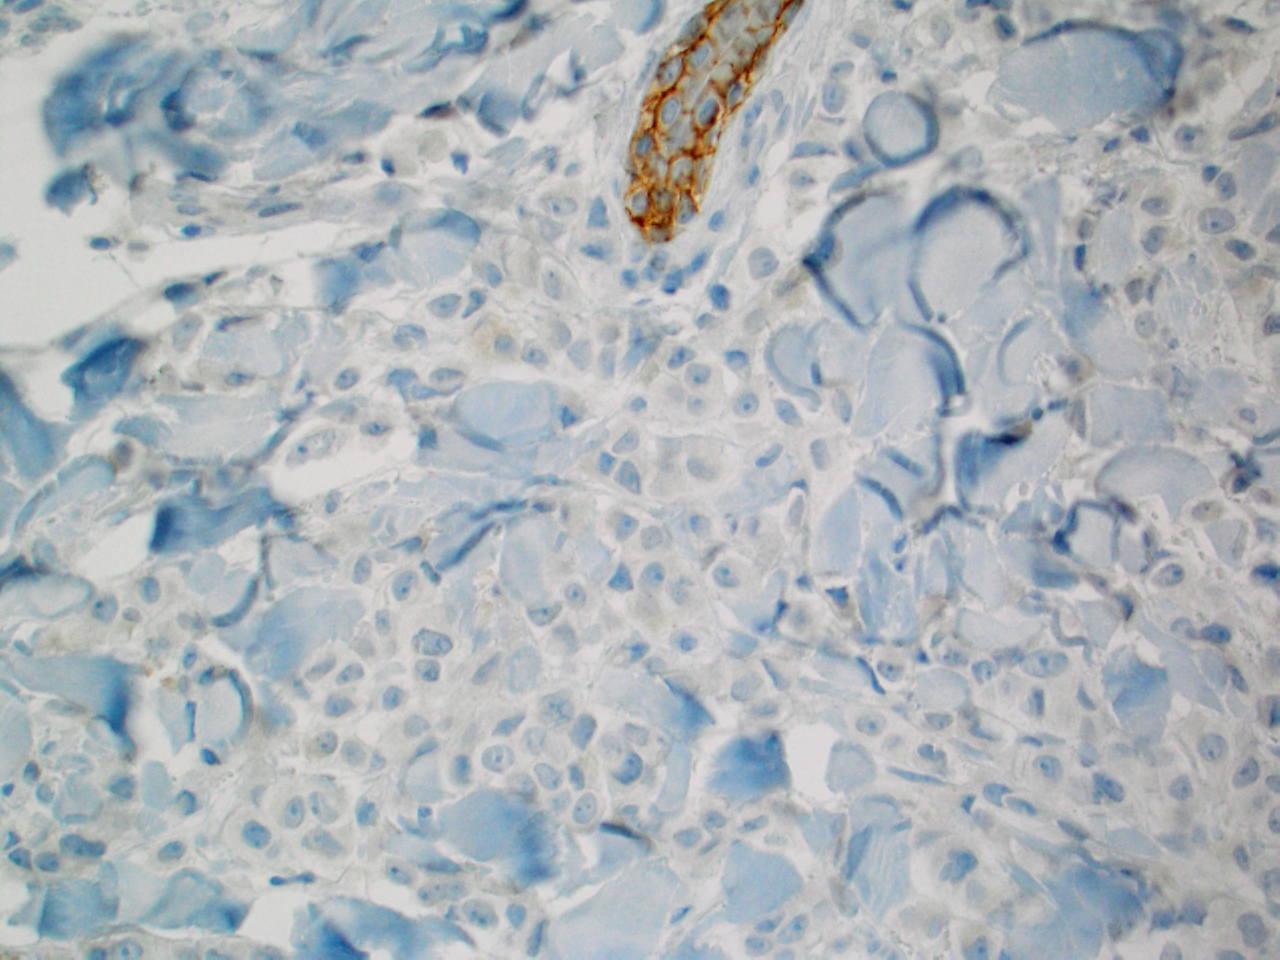 |
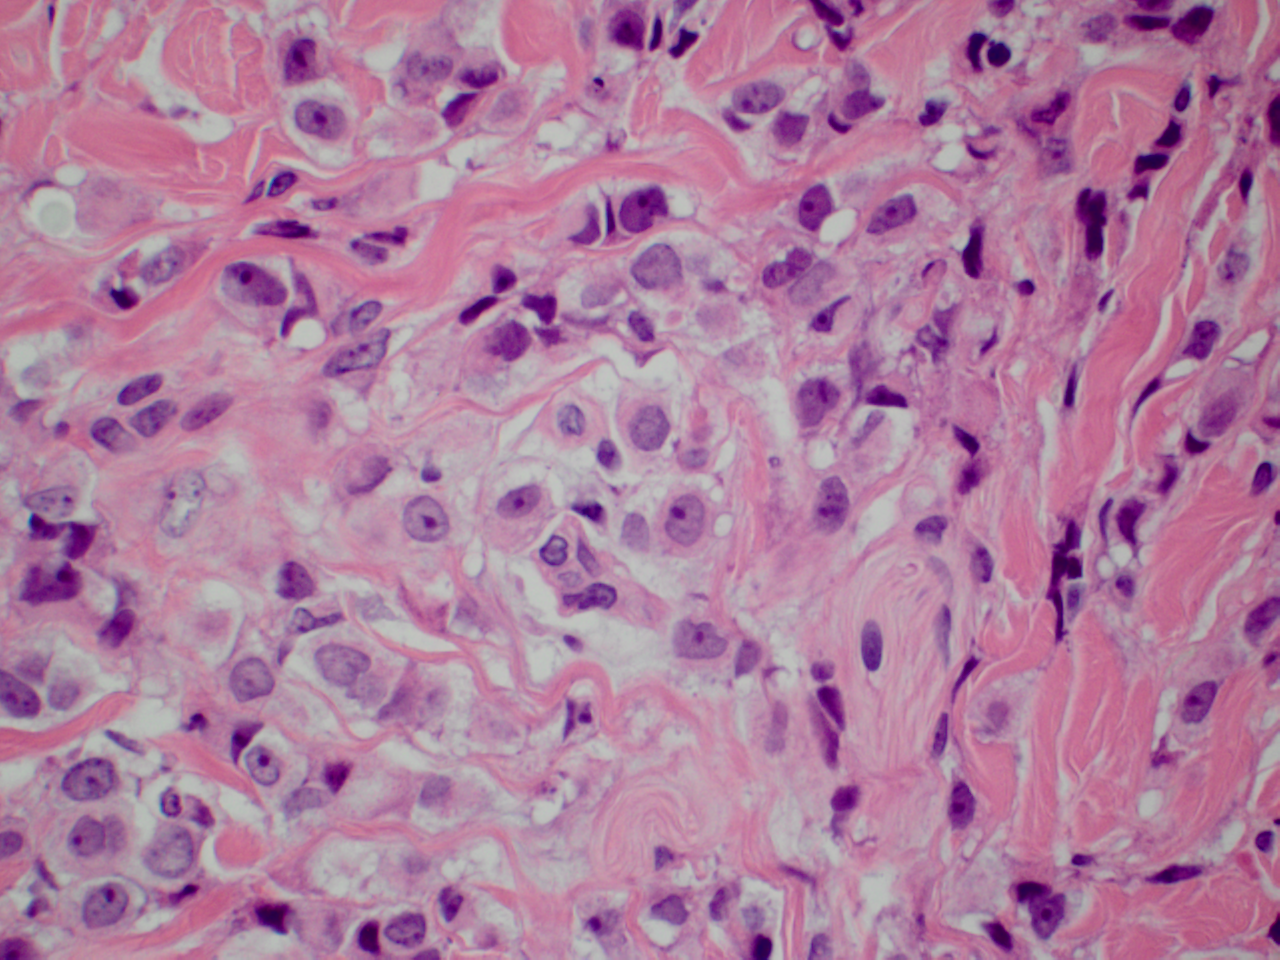
| Figure 3. H&E, 40x. | Figure 4. Loss of E-cadherin expression in invasive component (20x). |
 |
|
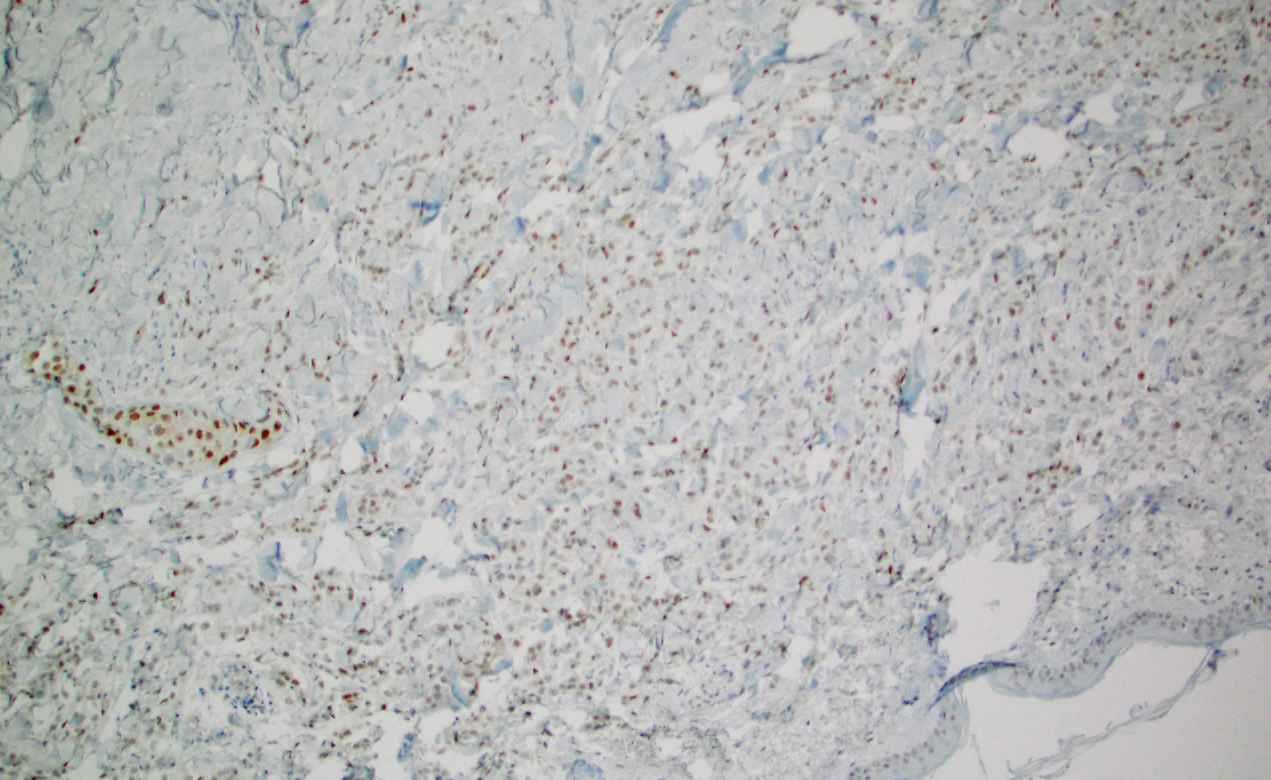
| Figure 5. The cancer cells were diffusely positive for androgen receptor (AR), 10x. |

Copyright 2012 – 2024 | BosnianPathology.org | Semir Vranic MD, PhD | Faruk Skenderi MD, PhD
next generation pathology