 |
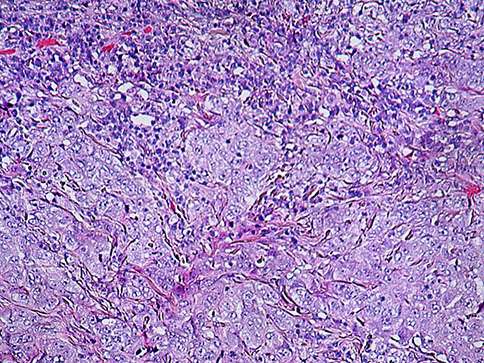 |
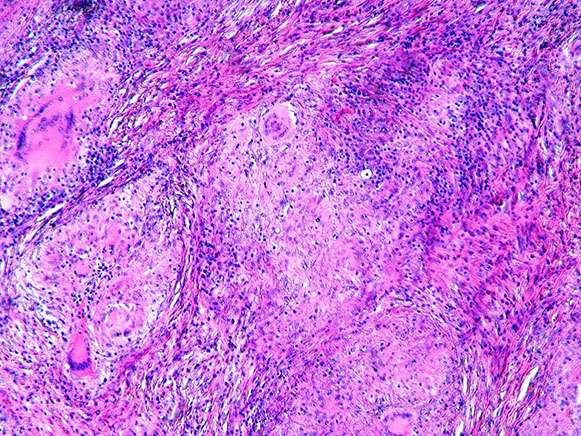
| Figure 1. H&E, 10x. | Figure 2. H&E, 20x. |
 |
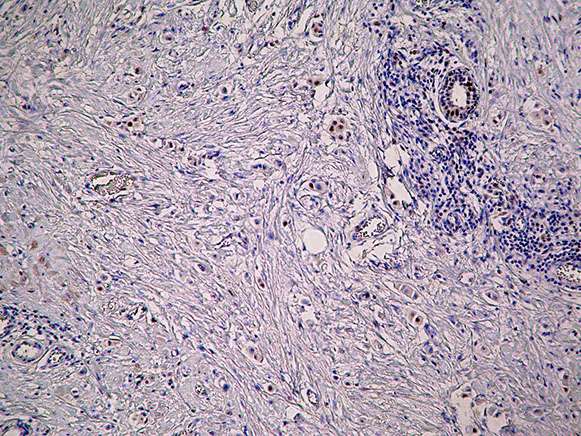 |
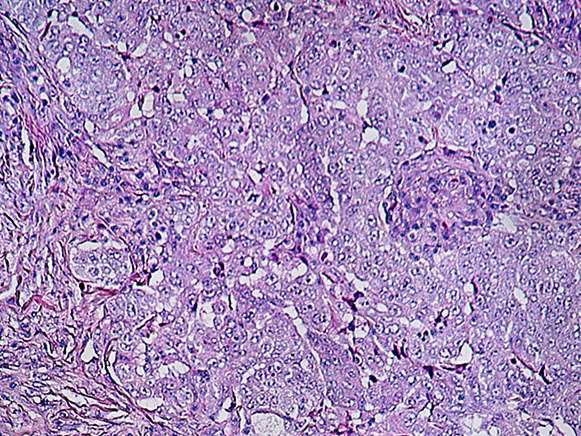
| Figure 3. H&E, 20x. | Figure 4. The tumor cells were negative for ER; note the presence of ER expression in adjacent normal ducts, 10x. |

Copyright 2012 – 2024 | BosnianPathology.org | Semir Vranic MD, PhD | Faruk Skenderi MD, PhD
next generation pathology