 |
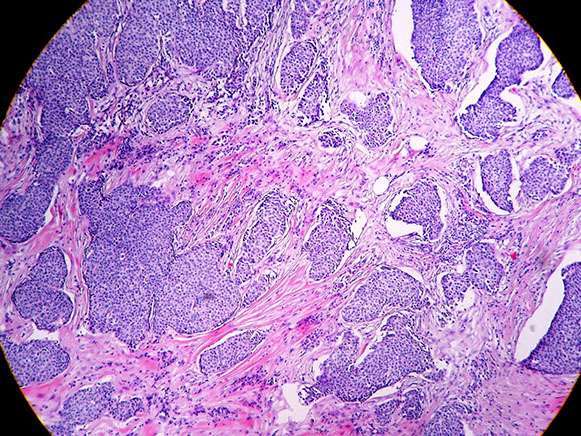 |
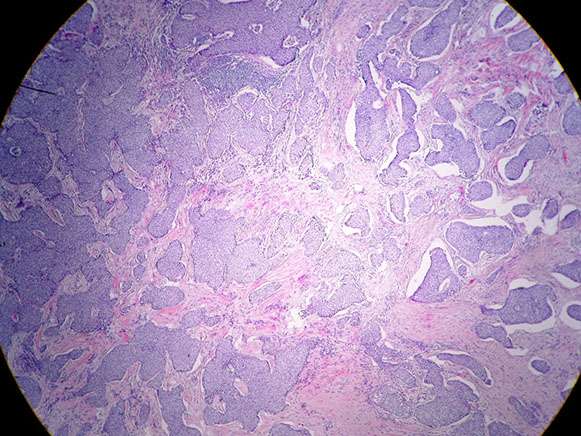
| Figure 1. H&E, 5x. | Figure 2. H&E, 10x. |
 |
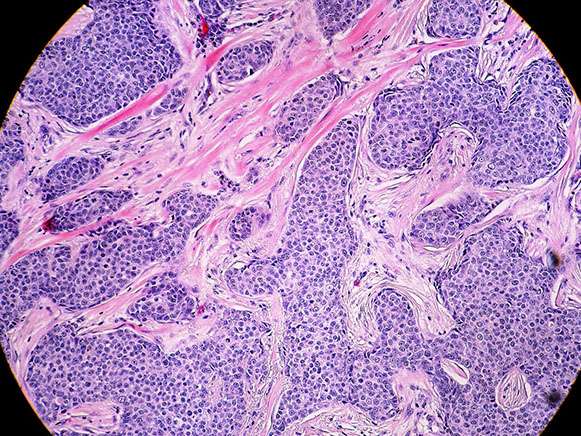 |
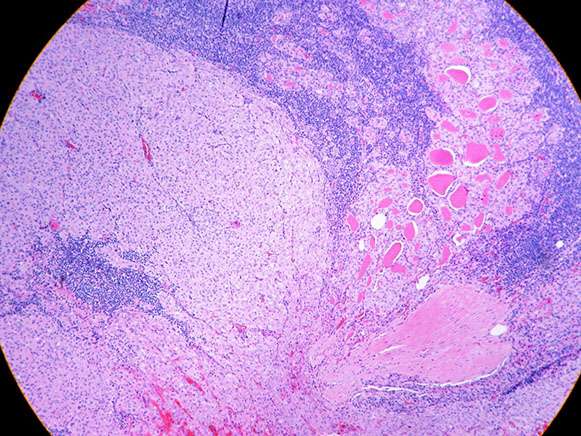
| Figure 3. H&E, 10x. | Figure 4. H&E, 20x. |
 |
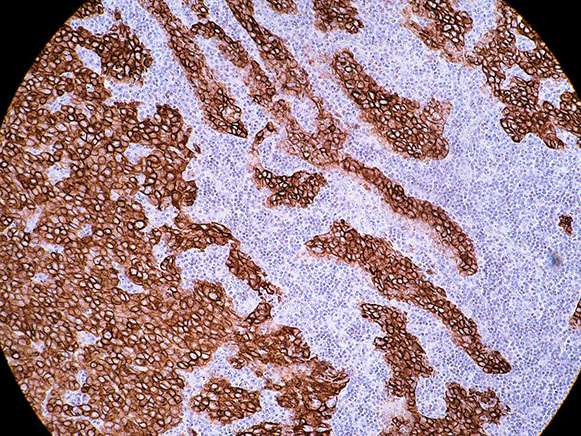 |
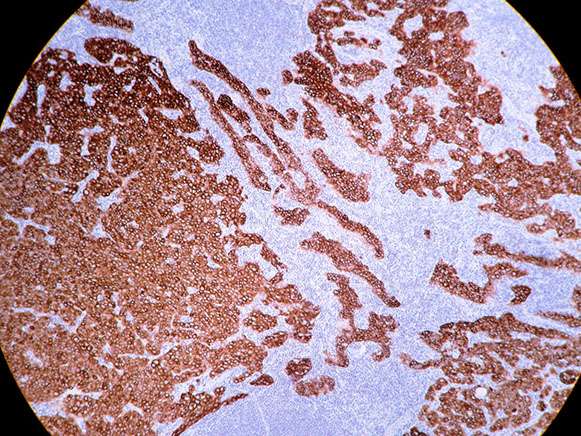
| Figure 5. Diffuse CK19 positivity in the tumor cells, 10x. | Figure 6. CK19 positivity, 20x. |
 |
|
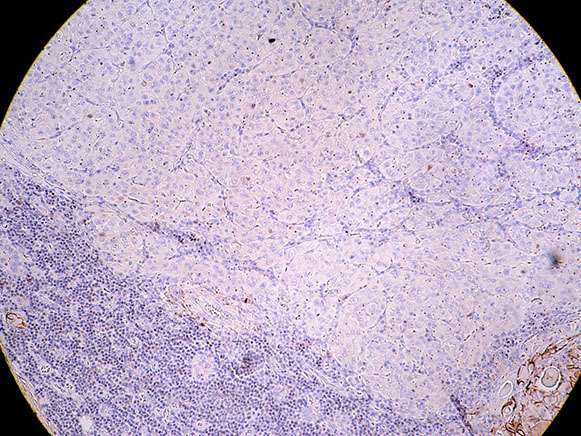
| Figure 7. CD56 was negative in the tumor cells; note the CD56 expression in adjacent normal thyroid epithelium, 10x. |

Copyright 2012 – 2024 | BosnianPathology.org | Semir Vranic MD, PhD | Faruk Skenderi MD, PhD
next generation pathology